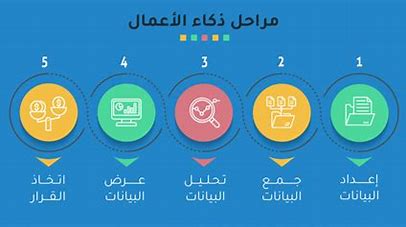
Data Analysis and Business Intelligence
Data Analysis and Business Intelligence
$3500.00
Day One: Introduction to Data Analysis and Business Intelligence
Today's goals:
Introducing the participants to the concept of data analysis and business intelligence.
Reviewing the importance of data analysis in making business decisions.
Familiarization with data analysis tools and techniques.
Content:
What is data analysis?
What is business intelligence?
The difference between traditional analysis and data analysis using artificial intelligence.
Introduction to the tools used (Excel, Power BI, Tableau).
Learning method:
Interactive lectures.
Group discussions.
Presenting practical examples.
Day Two: Data Collection and Analysis
Today's goals:
Understanding the importance of data collection.
Exploring methods of data collection and organization.
Learning how to clean and prepare data for analysis.
Content:
Data sources (internal and external).
Data collection techniques (surveys, databases, API).
Cleaning data using tools like Excel or Python.
Dealing with missing data and outliers.
Learning method:
Practical workshops.
Applications of data collection and analysis tools.
Real case studies.
Day Three: Statistical Data Analysis
Today's goals:
Learn the statistical basics for data analysis.
Using statistical tools to interpret data.
Content:
Basic statistical concepts (mean, standard deviation, distribution).
Data analysis using tables and graphs.
Understanding the relationship between variables using regression analysis.
Data analysis tools using Power BI or Python (Pandas).
Learning method:
Practical applications on real data.
Analysis of a set of statistical data.
Individual and group training.
Day Four: Designing Dashboards using Power BI
Today's goals:
Learn how to design interactive dashboards.
Understanding the importance of data visualization.
Content:
Introduction to Power BI.
Designing interactive reports using Power BI.
Creating dynamic dashboards.
Strategies for interpreting and presenting data effectively.
Learning method:
Practical training on Power BI.
Creating dashboards using real data.
Sharing patterns and techniques with colleagues.
Day Five: Practical Applications in Business Intelligence and Decision Making
Today's goals:
Understanding how to apply data analysis in improving business performance.
Exploring the role of business intelligence in strategic decision-making.
Content:
Practical applications in the business industry (sales, marketing, finance).
Case study on the application of data analysis in decision-making.
The use of artificial intelligence and machine learning in data analysis.
Learning method:
Discussion of case studies.
Practical applications of business intelligence tools.
Solving business problems using data analysis.
Target audience of the course:
Data analysts.
Business and project managers.
Marketing department employees.
IT professionals.
Anyone interested in learning data analysis and deriving business value from it.
Learning method:
A mix of theoretical and practical lectures.
Interactive workshops and solving real problems.
Case studies.
Using modern data analysis tools such as Excel, Power BI, and Python.


